Second set of considerations about the state of the world's energy supply Hewitt Crane. 1.*
I am the honest engineer that Doug referred to earlier, of forty-three years ago. When he hit me with that number, I just ricocheted a little bit and had to think that ten years before that I worked on one of the first big computers at IBM that worked at a whole twenty-five instructions a second; tons of relays and vacuum tubes. And, device density was measured in cubic inches per bit. And, it was hard to think that in one person's lifetime that has been involved with that, and to see what we have today. 3 And Doug mentioned another thing, about ant colonies, which made me think to quickly try to think to reconstruct some numbers I once did. E.O. Wilson, the Harvard ant-man, if I might be a little casual, estimates, if I remember, that the number of ants on Earth is ten to the sixteenth or ten to the seventeenth. And, massaging some of Gordon Bleur's numbers a couple years ago, and extrapolating for today, I can't believe that the number of transistors, equivalent transistors, produced per year today is less than ten to the seventeenth or eighteenth. There are more transistors being produced than there are ants on earth. But now if you want to do it per capita, then that gets kind of interesting, because you take that number and divide it by six billion people and there are approaching ten million transistors per capita per year. It doesn't matter per year because it's going so fast, all the others - hardly matters. It's only last year's production. Okay. Let's move on. Let's see. We aren't going, move fast enough. Ed Kinderman, who spoke to you last week, here's a summary of some of the things he said. 4
Energy is essential to modern industry, the modern world. No energy, no rooms, no internet, no lights, no cars, no nothing. Energy is under everything. But there's some really dangerous things happening. We live on fossil fuels, but they are very limited and being used at an ever-faster rate. And, the thing that's most scary is this glib talk about alternative energies that are going to be extremely difficult to implement. Now, the way we got started on this is Ed Kinderman, who's even older than me .... 6 Voice: Ten years. 7 H.C.: ... he has worked on, started in the early 1940s, on isotope separation and has been in the world of energy ever since. He has been in practically every phase of it. 8 I have no background whatsoever in this world, and just happened to stumble across a new unit that we think is going to make quite a difference; a unit of measure. We'll take the time of how that came about. But I'll show you in what sense we're creating a view; you're going to have to book now, for about six years now since coming to fruition. It's like cleaning the windows on such a complex system, this global energy system. This new unit is like cleaning the glass and you can see. And, you'll see in a moment what I mean by that. We'll see how this goes. Now, the current world of energy, it's an old business. It has evolved an enormous range of units of all sorts that are used today for oil, coal and gas, plus dozens of other units. 9 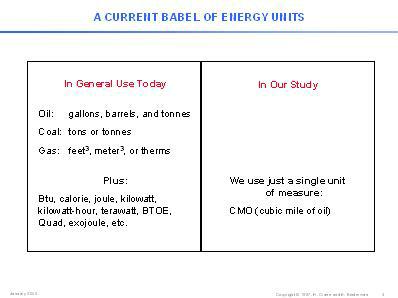 Fig. 1. 10
Just to keep track of the units or be able to communicate is a real chore. I won't even try to explain what some of those are. In our enterprise, we've used only one unit: the cubic mile. Now, never mind how that came about. Well, I'll tell you how it came about. 11 I was sitting in a long gas line with a lot of other people here in the early 70s, almost 30 years ago, and I said, "I wonder how much oil we use." So, I looked around and it was getting close to a trillion gallons per year. And, I said, "A trillion. It's not a million. It's not a billion. It's a trillion." I said, "Is that a lot?" Compared to what? And it turns out, besides you got a lot of ways to look at it, a cubic mile, a mile by a mile by a mile, contains a trillion gallons, close to it. I said, "That's interesting. We're using a cubic mile of oil per year" Wasn't at that time, not quite, but today we are passing through, it's continually increasing. Production this year is one cubic mile of oil, and still growing. Let's see, where are we going from here? Now, oil. You say, "Why should we build a unit out of oil?" Well, it just happens to be a very convenient unit, but oil is very special. And, unless people really understand it, you can continue to waste it as we do. 12
Oil can power a child's aircraft and the biggest jet flying; the same fuel. Don't look forward to solar panels on the wings or nuclear reactors on the inside, or even coal burning fires on the inside to power it. Oil is very special. So, the fact that we use a unit based on it is very appropriate. Now, let's see why this Babel of units that we all live in now, people involved in energy, is so confusing. 14 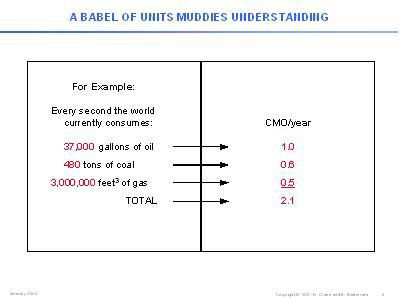 Fig. 2. 15
On the left, for example, there's some numbers: so many gallons per second, so many gallons of oil, how many tons of coal, et cetera. And, if I said to you, what's the total? You wouldn't have the foggiest idea. How do you add incompatible things? Alright, everything we do, everything is in terms of CMO, cubic miles of oil or the equivalent. You'll see no other unit. So, there it is. Oil is one CMO per year. And, there's coal and gas; 2.1 units are being consumed annually today of fossil fuel. Well, what else is there? Alternatives. Well, what about alternatives? There's on the top three rows the same numbers you just saw, 2.1 CMO. 16 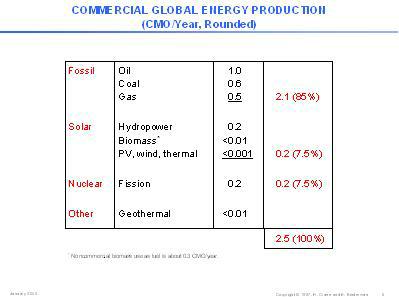 Fig. 3. 17
In the solar world, the only technology of any significance is hydro power, which has been around for a long time, hydroelectric power. And, that makes the equivalent of about 0.2. And then, there's biomass, which is commercial biomass, which is very small. And photovoltaic, wind and thermal - meaning these kind of fields that concentrate light, solar light, make heat, high temperature, energy - are insignificant for all of the hype of all the windmills here, and in Norway; and they're here in the west. The total production of all solar alternative energy is irrelevant. And, you'll shudder when I show you a few pictures of what it might cost, and the complexity of building that system. 18 Nuclear fission is also about 0.2. And there are other things: wave power, and tidal power, and OPEC; there's so many things, but they're all on the drawing boards. They're all researching. The only one else I mention to you is geothermal, steam underground, which derives, incidentally, from the cooling, molten core of the Earth plus radioactivity within the Earth, generates an outflow of approximately seven CMO per year of energy; comes out from the center of the Earth. And, we only capture less than 0.01 CMO. It's hard to get this energy. There's a lot of effort around, but it's hard to get it. 19 There's the world: 2.5 units. You don't have to worry about billions, trillions, and quadrillions. There are 2.5 units. Everything we talk about on an annual basis. You can use the fingers of one hand. You don't have to be confused, as many articles are, say trillions when they mean billions. Who cares? Factors of thousands, they're so big. No one ever understands when there are errors made in articles. 20 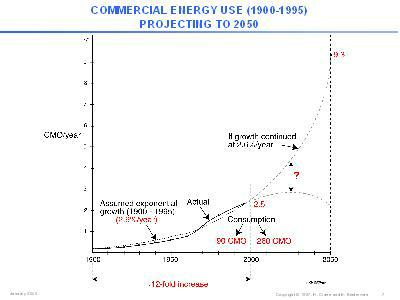 Fig. 4. 21
So, there we have: 2.5. How'd we get there? Started from about 1900, it was about 0.2. We're now up to 2.5. That dotted curve is an averaged-out exponential. It's compounding at a rate of 2.6 percent per year for a hundred years. So, we're up to 2.5. So, essentially, a twelve-fold increase. The amount of energy consumed to date, up to the year 2000, has been about 90 CMO, of which about 40 was oil taken out of the ground; 40 cubic miles of oil being moved from the ground. Now, if that rate continues at that 2.6 percent per year, by 2050 you'd be up to about 9 CMO per year, the equivalent of nine oil industries. Wait till I show you nine numbers how bid how big ... what that means. There's no way we're going to reach 9 CMO per year. 22 Okay. So, the question is, how are we going to constrain things and turn them around? And, how are we going to get through these 50 years? As they say, energy is not a subject that's on the radar screen. There's no concern. There's no public concern about this issue. It's a very complicated, critical issue. The UN has meeting on women's rights, and the environment, and population, and so on. Not yet, until we really push on them, to get energy on the radar screen, because we have no sense that it's even important. Alright. Now, forget all these numbers. I just tell you what , if you look here. 23 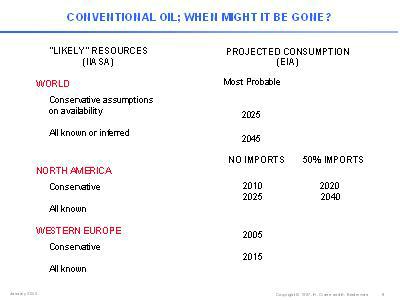 Fig. 5. 24
We'll start with Japan, which isn't listed. Japan has no energy resources, essentially zero. You move into Western Europe, these numbers here are when, the conservative estimates of how much oil is left, when it would run out.Western Europe, which has very little, will run out, depending on certain assumption, within five to ten or fifteen years. Out! North America isn't much better, but a little better. We don't have much left. Most of the oil taken to date since the industrial revolution came out of the United States, 40 CMO. There's only a few left. So, we're approaching some very dangerous times, very fast. And, the alternatives do not look very thrilling. 25 Now, it's not only just numbers. There's very severe international questions involved here, too, because there's a great mismatch between where energy is used, in the developed world now, and where it comes from. 26 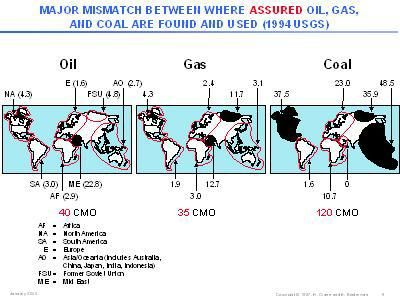 Fig. 6. 27
This is the conservative estimate of how much is about left worldwide of oil, gas, coal. Now, boy these pictures all change. This is the way the world is broken up by districts. The Middle East, not surprise to anyone here, has most of it; a one-lump model. Gas comes in two lumps, the Middle East. Gas is in two big lumps. And coal is in three big lumps. Okay, the bottom line here is there's a great geo-political problem here because wherever energy comes from isn't where it's used in the main, right now. That there's a naval patrol sort of on permanent duty in the Persian Gulf should be a surprise to no one. There are frightening things ahead. 28 So the situation with the fossil fuels is not very encouraging. Wait till I show you some things about what'll be involved in alternatives. 29
The alternatives are solar and nuclear. And, there's five issues: cost - there's going to be a significant increase in cost -- land area use, electricity storage for technologies like wind and photovoltaic. See, coal, oil, gas and nuclear come in stored form. Burn it when you need it. These - you only got it when the wind blows or the sun shines. So, there's a tremendous new need for mass, large-scale energy storage. Perception of danger, and limited, not very rapid rates of change, which I'll show you. I want to give you an idea of what it takes to make one CMO per year of energy. 31 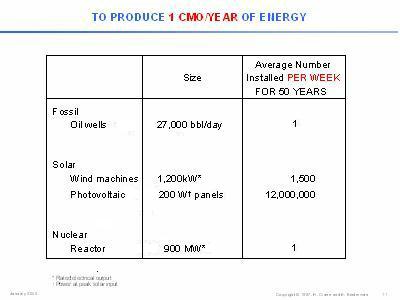 Fig. 7. 32
Let's look down here at a nuclear reactor. This's an average size, in the order of a thousand megawatts - that one below and over here. You would have to build one of these per week for 50 years. One nuclear reactor per week for 50 years. And if the first one's are still running after 50 years, you then have the equivalent of the cubic mile of oil that we currently use. Now, just for perspective, how big - suppose we're going to start some new oil industries. Joke. There's not that much around to do it, but what would it take? You'd have to find the equivalent of a thousand-megawatt reactor or a twenty-seven thousand barrels per day well; and you'd need one of those a week for fifty years. 33 Now, you sort of hold on to your hat. Let's move down here: wind machines. The biggest windmills of today, wind machines, are in the order of ten to twenty stories high -- huge machines. They're in the range more like a thousand kilowatt or a megawatt. So, in other words (speaker points at Fig. 7): this is more like a thousand megawatts; this is only one megawatt. Not surprising, you'd have to build 1500 windmills per week for 50 years to make the equivalent of one CMO of energy. Wait till you see what kind of land it will take up. If you don't think that's a major undertaking that will take, not exactly relying on the free-market to move on its own if it's such a risky thing. Wait till you see cost in a moment. What about photovoltaic panels? The typical 4-by-8 sheet of photovoltaic panels; they're only in the 200-watt range - 12 million per week for 50 years. Let's move on. We're going to get through these fast, in fact. Cost. Let's do it quickly. 34 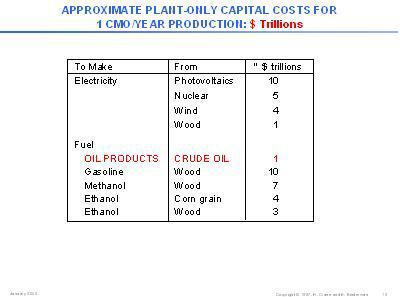 Fig. 8. 35
Okay, the entire oil industry today, if you just looked at the cost of refineries itself, which is the largest component: a trillion gallons. And, if you look at the numbers here - I can't read them, here so ... 36 Voice: A trillion dollars a year. 37 H.C.: Okay. Take photovoltaics. Ten trillion, and possibly, probably conservative. So, you're looking at these numbers much higher; oil comes cheap. The technology is cheap. We're talking many factors increase - got to go faster. Land; for reference look down here. 38 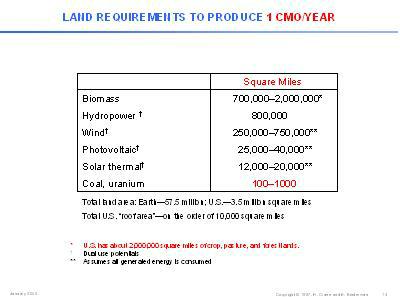 Fig. 9. 39
The U.S.: about 3 million square miles and about 2 million square miles of all sorts of crop, pasture, forest lands. 40 Look at commercial biomass, that means growing trees for energy use: 2 million square miles. In fact, it's worse than that because that's just to make more biomass. The biomass has no use until you convert it into some kind of fuel. And, that often comes at about 50 percent efficiency, or even less. Tremendous land is required. The coal and uranium come in volumetric form. And, these are spread out. Might be interesting, we were talking about numbers before, if you take a cubic mile of oil and spread it over the world, it would make a film less than a mil thick. If you take a reserve, say, 50 CMO reserve, it's equivalent to a few mils thick. All of the remaining energy available is equivalent to a film around the earth only a few mils thick. Now, I tell you that only because you get some idea of why it's so hard to get solar energy because it comes in the same spatial-aerial form, not volumetric form. So, solar is a very difficult path. 41 Now, just a couple of comments on nuclear because it's very sad. There's some very uninformed, incorrect - in our opinion - ideas out there about certain dangers of nuclear, and so on, which is unfortunate because nuclear can and will, we hope, will be an important part of the solution. Let me just comment on the first two. 42
There's great fear about radiation; and, there's great fear about radiation from nuclear accidents, radiation from normal operation nuclear accidents. Let me show you a chart. 44 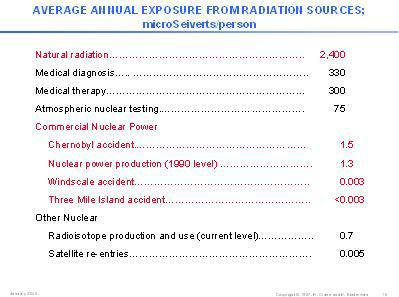 Fig. 10. 45
Natural radiation we all live with, so many units. Let's get down to the things that are related to nuclear, including the Chernobyl accident, which gets so much publicity, got so much, Three-Mile Island, and so on. They are relative noise compared to natural radiation. Let's take another, different kind of look: dangers to life. Starting with cigarettes, male smokers: 2,200 day lost on average - about six years of life on average. 46 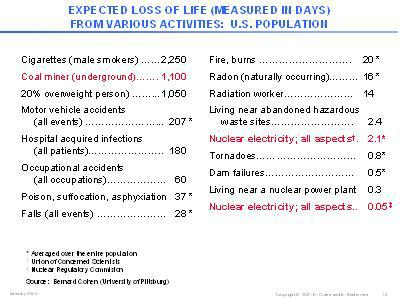 Fig. 11. 47
You come all the way down this list, and over here is nuclear electricity. One organization says, "Well, it's two days loss." And, one is 0.05 days per year. So, there might be considerable controversy by a factor of 40, in the irrelevant noise. There's a lot more to say about it but we got to keep going. 48 This is, to me, one of the most interesting charts: how long it took to develop today's industries. 49 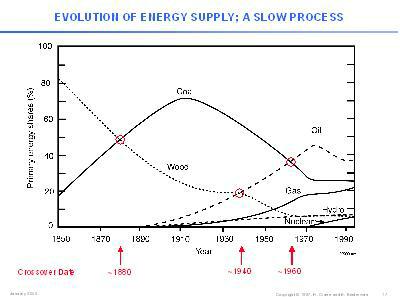 Fig. 12. 50
Before the industrial revolution, we sort of count from the late 1700s, and it was powered by wood -- the native forests. Now, this is a plot of shares. The total energy keeps going up, but this is the shares per year. So, if you add up all the units, it's 100 percent. So, it took until about 1880 for coal to finally surpass wood, at 50 percent each - 1880. It took till 1940 before oil overtook wood. To our shock when we saw this: it took till 1960 - this is where we almost fell off our seats when we saw - it took that long for oil to pass coal. Now, see oil, by share, is dropping off because finally nuclear is coming up and gas is coming up. Long times involved in making transitions to major industries. And, it surely doesn't happen just because people want it to happen. It can only come by a command decision that we shall do this because it's going to take enormous sums of money, enormous units of land. How would you even start to make twenty or thirty thousand miles of photocells? You might say, "Well, you're certainly not going to go all at once because there isn't even long-life statistics on these. How many are you willing to bet your life on?" Would you start with a square mile? That's huge, a square mile of photocells. You start with acres, and so on. But to get up to the kind of numbers we're talking about, is staggering. 51 I remind you; in closing here is great disparity between who uses energy today and who has it. 52 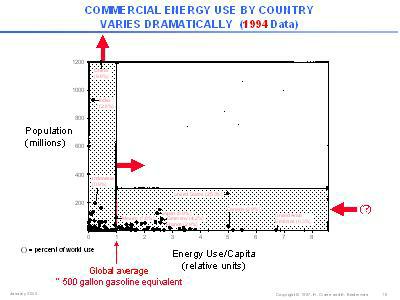 Fig. 13. 53
And, that's the seed of some enormous, difficult, international situations going to be based on it. I'll show you this last picture - kind of interesting. When I first started working with Ed, oh six or seven years ago, I said, "I want to see a list of all the countries." So, we had some UN publications of how much energy they used. Your eyes go like this - they're numbers without end. We said, "Hey, there must be a better way to present this." So we said, "Look, energy is energy per unit - a state, a country - is energy per capita times how many capita, people." So we said, "Okay, let's make a two-dimensional plot of population versus energy per capita." So, every country is a dot. And the unit along here is global average, which turns out to be 500 gallons per capita. The world currently uses, on average, 500 gallons of gasoline-equivalent per capita; the United States having about five times as much per person. Places like China - that one has about ten times less. India has about twenty times less than the United States. So, this is most of the consuming countries today. And, this is the developed, so to speak, countries. And, this is where the big changes are going to be happening because populations are still increasing and energy use is going up as these countries start to develop. That's where a big problem is going to face us, which was summarized - we didn't - we just took a sketch and started giving you some of our fancy numbers. 54 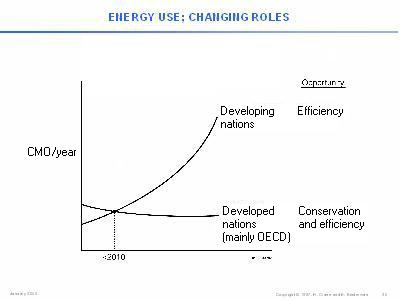 Fig. 14. 55
If you plotted the first, the developing-nation, group up through, say, 2050, they'll probably be able to control themselves in energy use, and it might actually decrease. But the developing nations are going to, we estimate, pass the developed nations in energy use as early as 2010, or earlier. And this is going to be what will wag the dog. 56 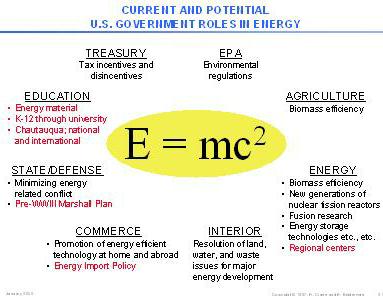 Fig. 15. 57
This is something we drew yesterday just for fun. We said, "Hey, this is a big problem. This is one of the biggies as far as survival, in many ways, of modern society." So, we said, "Well hey, let's name some of the major departments of government from that point of view." What's in it for them? Does it come out of any one? It comes out of all of them. Obviously the Energy Department has many things to do. Department of the Interior: resolution of major mending, not- in-my-backyard problems of land, water, and waste issues. How do think it will look when you have thousands of square miles of twenty-story windmills that you drive by instead of corn as high as the elephant's eye, and so on? Big change is coming if we're going to survive as we know it. Commerce Department: promotion of energy efficient technology at home and abroad. Things in red I'm prepared to say a few things about but I think we're going to stop anyway. There are some very important things about import policy. State and Defense: minimizing energy related conflict - put down here pre-World War III Marshal Plan. After World War II, we had a Marshal Plan that rebuilt Europe, one of those great events in history. We'd better be smart and do the equivalent of a Marshal Plan to avoid World War III by providing the most efficient energy technology to the developing world or we're all going to be in very grave trouble. In education there's some very important things, which ... I'm over time. I'm going to stop right there. If anyone wants to talk about these things, I'd be happy to do so. 58
---
Above space serves to put hyperlinked
targets at the top of the window
|
